The token gains and losses report
Every disposal of one token and every acquisition lot behind it, so you can show where a figure comes from.
Where to find it:your-organization.conta.financeGains & lossesa token
The token report shows the cost basisWhat you paid for the assets you hold or disposed of. of one token, line by line. It answers the two questions of a reviewer. The Acquisition lots tab shows where the cost basis comes from. The Disposals tab shows how each gain arose.
To open it, select a token on the Gains & losses page. See The Gains & losses page.
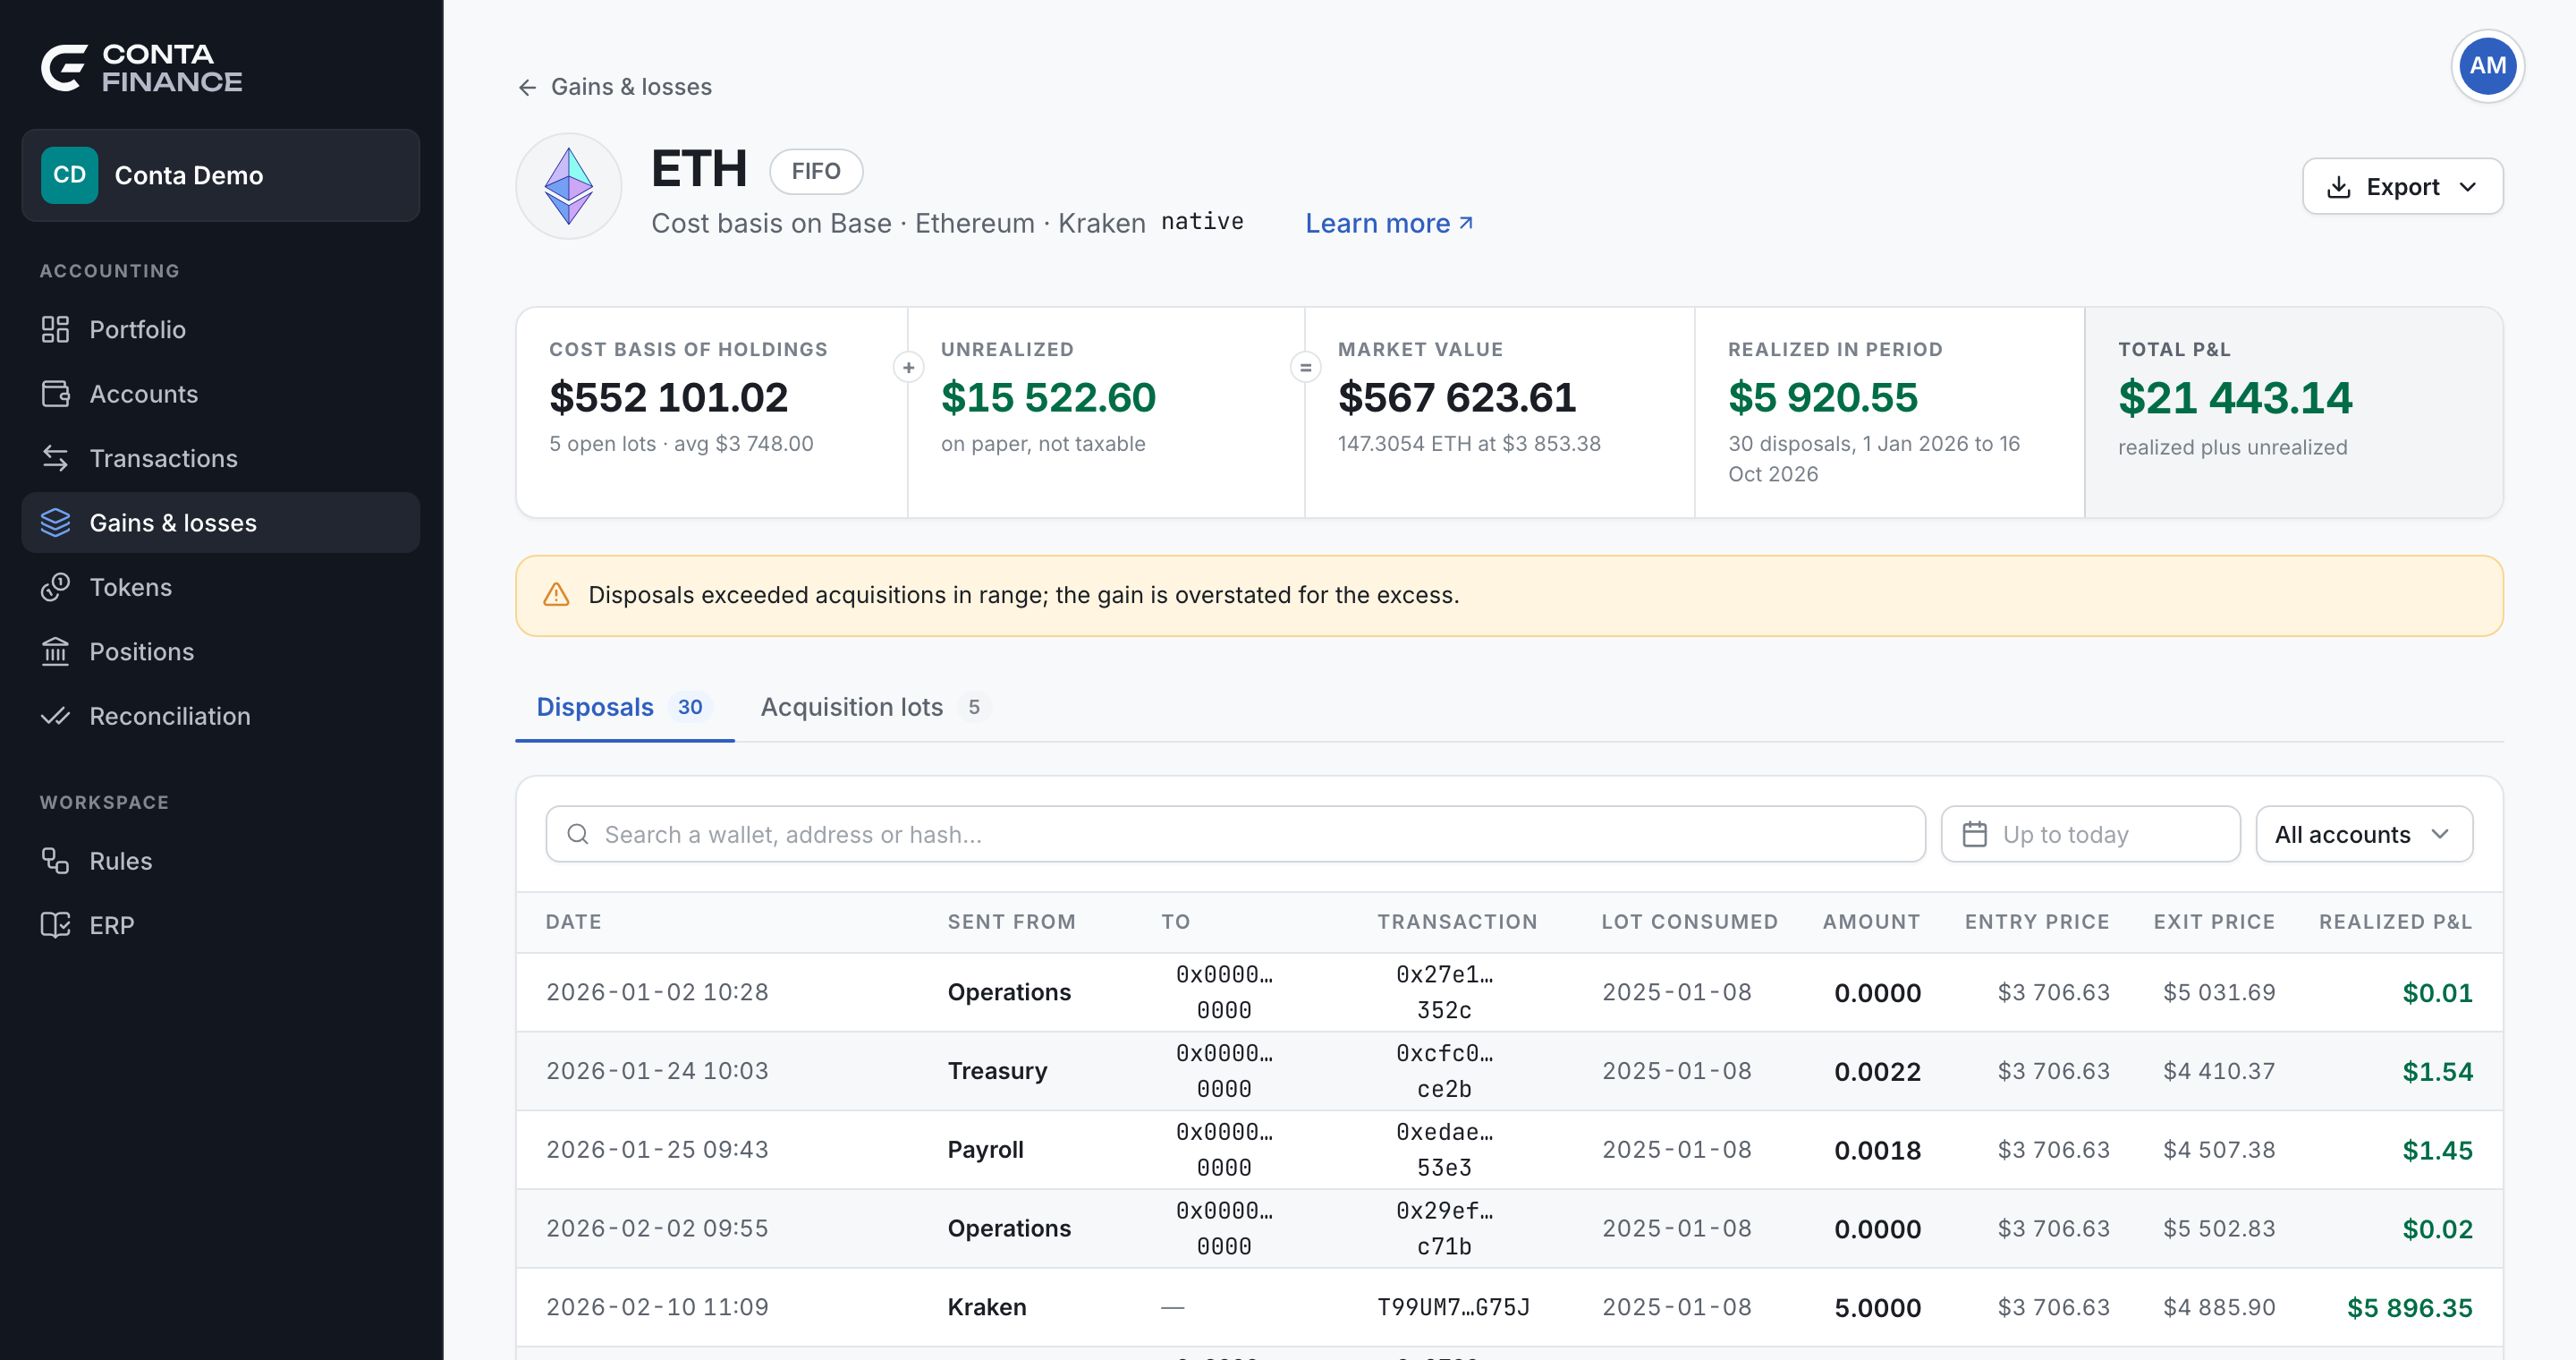
The header
| Element | What it shows |
|---|---|
| Back link | Goes back to the Gains & losses page, with the same as-of date and accounts. In a saved reportA copy of the gains and losses figures, stored under a name. Nothing calculates it again, so it never changes., it goes back to that report. |
| Title | The ticker of the token. |
| Method chip | The cost basis method: FIFO, LIFO or Average cost. Select it to open Organization settings. |
| Price stale | The latest price of the token is more than one day old. Market value and unrealized P&L can be out of date. |
| Partial | Some movements of the token have no price, so the cost figures are not complete. |
| Description | The platforms the position moved on, and the token contract. |
| Export | Writes both tabs: every disposal of the period and every lot, with the filters applied. See Export data. |
When a figure is not complete, a warning under the band says why. Its button, Add prices or Review price, opens Unpriced movements. See Fix what needs attention.
The band
The band reads from left to right as one sum: cost basis plus unrealized equals market value.
| Cell | Meaning |
|---|---|
| Cost basis of holdings | What the open lots cost. Under it: the number of open lots and the average cost. |
| Unrealized | Market value minus cost basis. It is on paper and is not taxable. |
| Market value | The amount you hold at the latest price. |
| Realized in period | The gains and losses of the disposals in the fiscal year that contains the as-of date. Under it: the number of disposals and the two days of the period. |
| Total P&L | Realized plus unrealized. |
Filters
The toolbar of the Disposals tab holds the filters. The as-of date and the accounts apply to both tabs.
- Search finds a disposal by the account it left, the address it went to, or its hash. It searches every disposal, not only the page on screen.
- As-of date sets the last day the report reads.
- Accounts limits the report to some of your accounts. All accounts is the default.
The Disposals tab
One row for each disposalAn asset leaving your portfolio, by a sale, a swap or a payment. It consumes lots. in the period, oldest first.
| Column | What it shows |
|---|---|
| Date | The day and time of the disposal, in UTC. |
| Sent from | Your account the token left. |
| To | The address that received it. |
| Transaction | The hash, with a link to the explorer. |
| Lot consumed | The day of the lot the disposal consumed. When it consumed lots of more than one day, the number of lots. A dash when it matched no lot. |
| Amount | The token amount. |
| Entry price | The cost of one unit, from the lots consumed. |
| Exit price | The price of one unit at the disposal. |
| Realized P&L | What the disposal received minus the cost of the lots it consumed. |
The footer reads Total on this page and adds the amount and the realized P&L of the rows on screen. Choose 25, 50 or 100 rows for each page.
A disposal with no price still shows, because it happened. Its money columns stay empty.
The Acquisition lots tab
One row for each acquisition lotOne acquisition of an asset: how much came in, when, and at what cost. up to the as-of date, oldest first. The tab lists every lot, not only the lots of the period, because a disposal of this year can consume a lot of any year.
| Column | What it shows |
|---|---|
| Acquired | The day the token came in. |
| Wallet | The account it came into. |
| Source | The category of the movement. Transfer in when it has no category. |
| Acquired qty | The amount that came in. |
| Unit cost | The price of one unit on that day. |
| Remaining | The amount no disposal consumed yet. |
| Cost basis | The cost of the remaining amount. |
| Unrealized | The market value of the remaining amount minus its cost. |
| Status | Open while some amount remains. Consumed when nothing remains. Consumed rows are dimmed. |
The footer counts the open lots. Its Cost basis equals the cost basis in the band.
If a movement of the token has no price, the tab shows no lots. Add the missing prices to see them.
Read one disposal
Take one row of the Disposals tab and find its lots:
- Read Lot consumed. It gives the day of the lot.
- Open Acquisition lots and find the lot with that day in Acquired.
- Compare Entry price with the Unit cost of the lot.
When a disposal consumes more than one lot, Entry price is the weighted average of those lots, and the export lists the day of each lot. A disposal that matched no lot sold more than you bought: see Fix what needs attention.
For example, with FIFO you buy 1 ETH on 10 January at $2 000, and 1 ETH on 2 March at $3 000. On 20 May you sell 1.5 ETH at $3 500.
| Column | Value |
|---|---|
| Lot consumed | 2 lots |
| Amount | 1.5 |
| Entry price | $2 333.33 |
| Exit price | $3 500 |
| Realized P&L | $1 750 |
The sale consumed all of the January lot and half of the March lot: $2 000 plus $1 500 is $3 500 of cost for 1.5 ETH. In the Acquisition lots tab, the January lot is Consumed. The March lot is Open, with 0.5 remaining and a cost basis of $1 500.
With Average cost, the cost is shared across all the lots. The amount is taken from the oldest open lot first, so Lot consumed still names a day. See Cost basis methods.
In a saved report
When you open a token from a saved report, a line under the title names the report, the day it reads until, and when it was created. The as-of date and the accounts are fixed, so they leave the toolbar. The search still works on the stored disposals. See Saved reports.